Market Outlook
October 24, 2017
Market Cues
Domestic Indices
Chg (%)
(Pts)
(Close)
Indian markets are likely to open flat tracking global indices and SGX Nifty.
BSE Sensex
0.4
117
32,507
The S&P 500 and the Dow snapped a six-day winning streak on Monday as
Nifty
0.4
38
10,185
investors weighed prospects for tax cuts while parsing the latest corporate earnings
Mid Cap
0.4
72
16,148
for clues on where stocks are headed in the near term. The S&P 500 index SPX,
Small Cap
0.1
15
17,097
dropped 0.4%, to close at 2,565. The Dow Jones Industrial Average DJIA, -shed
0.2%, to 23,274.
Bankex
0.2
45
26,887
U.K. stocks ended a choppy session marginally higher on Monday, with traders
Global Indices
Chg (%)
(Pts)
(Close)
opting to err on the side of caution ahead of a busy week of economic data and
earnings. The FTSE 100 index UKX, 0.02% to close at 7,524, leaving it within
Dow Jones
(0.2)
(55)
23,274
touching distance of its record close of 7,556 hit earlier in October.
Nasdaq
(0.6)
(42)
6,587
FTSE
0.0
1
7,524
Indian shares rose on Monday, with telecom stocks as well as heavyweight Reliance
Industries leading the surge after Jio raised effective prices of most 4G tariff. On
Nikkei
0.1
27
21,724
Monday BSE Sensex closed up 0.4% to 32,507, while the Nifty 50 edged up 0.4% to
Hang Seng
0.0
4
28,309
close at a new peak, 10,185.
Shanghai Com
0.2
6
3,387
News Analysis
Advances / Declines
BSE
NSE
Infosys - 2QFY18 result update
Advances
1,272
830
Detailed analysis on Pg2
Declines
1,474
923
Investor’s Ready Reckoner
Unchanged
126
62
Key Domestic & Global Indicators
Volumes (` Cr)
Stock Watch: Latest investment recommendations on 150+ stocks
Refer Pg5 onwards
BSE
3,905
NSE
29,180
Top Picks
CMP
Target
Upside
Company
Sector
Rating
(`)
(`)
(%)
Net Inflows (` Cr)
Net
Mtd
Ytd
Blue Star
Capital Goods Accumulate
805
867
7.7
FII
(1,120)
(5,606)
30,924
Dewan Housing Finance
Financials
Accumulate
583
670
14.9
MFs
947
6,413
92,756
Asian Granito
Other
Accumulate
499
570
14.1
Navkar Corporation
Other
Buy
199
265
33.3
KEI Industries
Capital Goods
Buy
322
380
18.0
Top Gainers
Price (`)
Chg (%)
More Top Picks on Pg4
Gmdcltd
174
11.8
Torntpower
271
9.4
Key Upcoming Events
Previous
Consensus
Sobha
516
9.0
Date
Region
Event Description
Reading
Expectations
Gnfc
514
8.9
Oct 24
Germany PMI Manufacturing
60.60
60.00
Gmrinfra
17
7.8
Oct 24
UK
GDP (YoY)
1.50
1.50
Oct 25
Germany PMI Services
55.60
55.50
Oct 25
US
New home sales
560.00
554.00
Top Losers
Price (`)
Chg (%)
Oct 26
US
GDP Qoq (Annualised)
3.10
2.50
Denabank
27
(4.9)
More Events on Pg7
Pcjeweller
346
(4.3)
Religare
45
(4.0)
Ghcl
251
(3.9)
Bomdyeing
204
(3.8)
As on October, 23 2017
Market Outlook
October 24, 2017
News Analysis
Infosys - 2QFY18 result update
Infosys is slated to announce its 2QFY2018 results today. We expect the company
to post 3.1% sequential growth in USD revenues to US$2,755mn. In rupee terms,
revenues are expected to come in at `17,604cr, up 3.1% qoq. EBIT margin is
expected to show an dip of ~48bp qoq to end the period at 23.6%. Consequently,
PAT is expected to be at `3,590cr, a rise of 1.6% qoq. We maintain our buy rating
on the stock with a target price of `1,179.
Y/E
Sales OPM
PAT
EPS ROE P/E P/BV EV/EBITDA EV/Sales
March
(` cr)
(%)
(` cr)
(`)
(%)
(x)
(x)
(x)
(x)
FY2018E
73,963
26.0
14,785
64.4
19.7
13.8
2.7
9.5
2.5
FY2019E
80,619
26.0
15,916
69.3
19.6
12.8
2.5
8.5
2.2
Economic and Political News
` 7 lakh crore highway plan set to get Cabinet’s nod on today
RBI forms task force on public credit registry.
Jan Dhan accounts see surge in cash inflows in past 3 months
Corporate News
IVRCL Infra lenders decide to exit from corporate debt restructuring
Cochin Shipyard forms a joint venture with Hooghly Dock & Port Engineers
Reliance Communications to merge wireless business of Sistema Shyam with
itself.
IndiaBulls housing finance net profit up 25.8% to `861cr.
Market Outlook
October 24, 2017
Quarterly Bloomberg Brokers Consensus Estimate
HDFC Bank - Oct 24, 2017
Particulars ( `cr)
2QFY18E
2QFY17
y-o-y (%)
1QFY18
q-o-q (%)
PAT
4,171
3,455
20.7
3,893
7.2
Infosys Ltd - Oct 24, 2017
Particulars ( ` cr)
2QFY18E
2QFY17
y-o-y (%)
1QFY18
q-o-q (%)
Sales
17,644
17,310
1.9
17,078
3.3
EBIDTA
4600
4,730
(2.8)
4,490
2.4
%
26.1
27.4
26.3
PAT
3530
3,606
(2.1)
3,483
1.4
Ambuja Cement Ltd - Oct 24, 2017
Particulars ( ` cr)
2QFY18E
2QFY17
y-o-y (%)
1QFY18
q-o-q (%)
Sales
2,280
2,031
12.3
2,861
(20.3)
EBIDTA
364
303
20.1
651
(44.1)
%
15.9
14.9
22.7
PAT
240
277
(13.4)
392
(38.8)
Radico Khaitan Ltd - Oct 24, 2017
Particulars ( ` cr)
2QFY18E
2QFY17
y-o-y (%)
1QFY18
q-o-q (%)
Sales
457
447
2.3
411
11.2
EBIDTA
62
56
10.7
63
(1.6)
%
13.6
12.6
15.1
PAT
25
23
8.7
26
(3.9)
Rallis Ltd - Oct 24, 2017
Particulars ( ` cr)
2QFY18E
2QFY17
y-o-y (%)
1QFY18
q-o-q (%)
Sales
624
548
13.9
445
40.3
EBIDTA
118
104
13.5
70
68.5
%
18.9
18.8
15.7
PAT
79
67
17.9
46
71.1
Market Outlook
October 24, 2017
Top Picks ★★★★★
Market Cap
CMP
Target
Upside
Company
Rationale
(` Cr)
(`)
(`)
(%)
Strong growth in domestic business due to its leade`hip
in acute therapeutic segment. Alkem expects to launch
Alkem Laboratories
22,279
1,863
2,079
11.6
more products in USA, which bodes for its international
business.
We expect the company would report strong profitability
Asian Granito
1,502
499
570
14.1
owing to better product mix, higher B2C sales and
amalgamation synergy.
Favorable outlook for the AC industry to augur well for
Cooling products business which is out pacing the
Blue Star
7,711
805
867
7.7
market growth. EMPPAC division's profitability to
improve once operating environment turns around.
With a focus on the low and medium income (LMI)
consumer segment, the company has increased its
Dewan Housing Finance
18,278
583
670
14.9
presence in tier-II & III cities where the growth
opportunity is immense.
Loan growth is likely to pick up after a sluggish FY17.
Lower credit cost will help in strong bottom-line growth.
Karur Vysya Bank
7,880
130
180
38.0
Increasing share of CASA will help in NIM
improvement.
High order book execution in EPC segment, rising B2C
KEI Industries
2,505
322
380
18.0
sales and higher exports to boost the revenues and
profitability
Expected to benefit from the lower capex requirement
Music Broadcast
2,202
386
434
12.4
and 15 year long radio broadcast licensing.
Massive capacity expansion along with rail advantage
Navkar Corporation
2,834
199
265
33.3
at ICD as well CFS augur well for the company
Strong brands and distribution network would boost
Siyaram Silk Mills
2,600
2,774
2,914
5.1
growth going ahead. Stock currently trades at an
inexpensive valuation.
Market leaderhip in Hindi news genre and no.
2
viewe`hip ranking in English news genre, exit from the
TV Today Network
2,099
352
435
23.6
radio business, and anticipated growth in ad spends by
corporates to benefit the stock.
After GST, the company is expected to see higher
volumes along with improving product mix. The Gujarat
Maruti Suzuki
2,36,209
7,819
8,658
10.7
plant will also enable higher operating leverage which
will be margin accretive.
We expect loan book to grow at 24.3% over next two
GIC Housing
2,690
499
655
31.1
year; change in borrowing mix will help in NIM
improvement..
Source: Company, Angel Research
Market Outlook
October 24, 2017
Key Upcoming Events
Global economic events release calendar
Bl oomberg Data
D ate
Time
C ountry
Event Description
Unit
Period
L ast Reporte d
E stimate d
Oct 24, 2017
1:00 PM Germany
PMI Manufacturing
Value
Oct P
60.60
60.00
2:00 PM UK
GDP (YoY)
% Change
3Q A
1.50
1.50
Oct 25, 2017
1:00 PM Germany
PMI Services
Value
Oct P
55.60
55.50
7:30 PM US
New home sales
Thousands
Sep
560.00
554.00
Oct 26, 2017
6:00 PM US
GDP Qoq (Annualise d)
% Change
3Q A
3.10
2.50
6:00 PM US
Initial Jobless claims
Thousands
Oct 21
222.00
235.00
Oct 27, 2017
5:15 PM Euro Zone
ECB announces interest rates
%
Oct 26
-
-
Oct 31, 2017
6:30 AM China
PMI Manufacturing
Value
Oct
52.40
7:30 PM US
Consumer Confidence
S.A./ 1985=100
Oct
119.80
121.00
3:30 PM Euro Zone
Euro-Zone GDP s.a. (QoQ)
% Change
3Q A
0.70
Nov 01, 2017
3:00 PM UK
PMI Manufacturing
Value
Oct
55.90
11: 30 PM US
FOMC rate decision
%
Nov 1
1.25
1.25
Nov 02, 2017
2:25 PM Germany
Unempl oyment change (000's)
Thousands
Oct
(22.00)
5:30 PM UK
BOE Announce s rate s
% Ratio
Nov 2
0.25
0.50
Nov 03, 2017
6:00 PM US
Change in N onfarm payrolls
Thousands
Oct
(33.00)
300.00
6:00 PM US
Unnemployment rate
%
Oct
4.20
4.20
Nov 08, 2017
7:00 AM China
Consumer Price Index (YoY)
% Change
Oct
1.60
Nov 09, 2017
China
Exports YoY%
% Change
Oct
8.10
3:00 PM UK
Industrial Production (YoY)
% Change
Sep
1.60
Nov 10, 2017
India
Imports YoY%
% Change
Oct
18.09
India
Exports YoY%
% Change
Oct
25.67
5:30 PM India
Industrial Production YoY
% Change
Sep
4.30
Nov 14, 2017
7:30 AM China
Industrial Production (YoY)
% Change
Oct
6.60
3:00 PM UK
CPI (YoY)
% Change
Oct
3.00
Source: Bloomberg, Angel Research
Market Outlook
October 24, 2017
Key Upcoming Events
Result Calendar
D ate
C ompany
October 24, 2017
Rallies, ABB, Ambuja Cement, HDFC Bank, Infosys, Radico Khaitan
October 25, 2017
Exide Industries, Kotak Mahindra Bank, HUL , HCL Tech, Mindtree, NIIT, GSK PHarma
Source: Bloomberg, Angel Research
Global economic events release calendar
Bl oomberg Data
D ate
Time
C ountry
Event Description
Unit
Period
L ast Reporte d
E stimate d
Oct 24, 2017
1:00 PMGermany PMI Manufacturing
Value
Oct P
60.60
60.00
2:00 PMUK
GDP (YoY)
% Change
3Q A
1.50
1.50
Oct 25, 2017
1:00 PMGermany PMI Services
Value
Oct P
55.60
55.50
7:30 PMUS
New home sales
Thousands
Sep
560.00
554.00
Oct 26, 2017
6:00 PMUS
GDP Qoq (Annualise d)
% Change
3Q A
3.10
2.50
6:00 PMUS
Initial Jobless claims
Thousands
Oct 21
222.00
235.00
Oct 27, 2017
5:15 PMEuro Zone ECB announces interest rates
%
Oct 26
-
-
Oct 31, 2017
6:30 AMChina
PMI Manufacturing
Value
Oct
52.40
7:30 PMUS
Consumer Confidence
S.A./ 1985=100
Oct
119.80
121.00
3:30 PMEuro Zone Euro-Zone GDP s.a. (QoQ)
% Change
3Q A
0.70
Nov 01, 2017
3:00 PMUK
PMI Manufacturing
Value
Oct
55.90
11: 30 PMUS
FOMC rate decision
%
Nov 1
1.25
1.25
Nov 02, 2017
2:25 PMGermany Unempl oyment change (000's)
Thousands
Oct
(22.00)
5:30 PMUK
BOE Announce s rate s
% Ratio
Nov 2
0.25
0.50
Nov 03, 2017
6:00 PMUS
Change in N onfarm payrolls
Thousands
Oct
(33.00)
300.00
Source: Bloomberg, Angel Research
Market Outlook
October 24, 2017
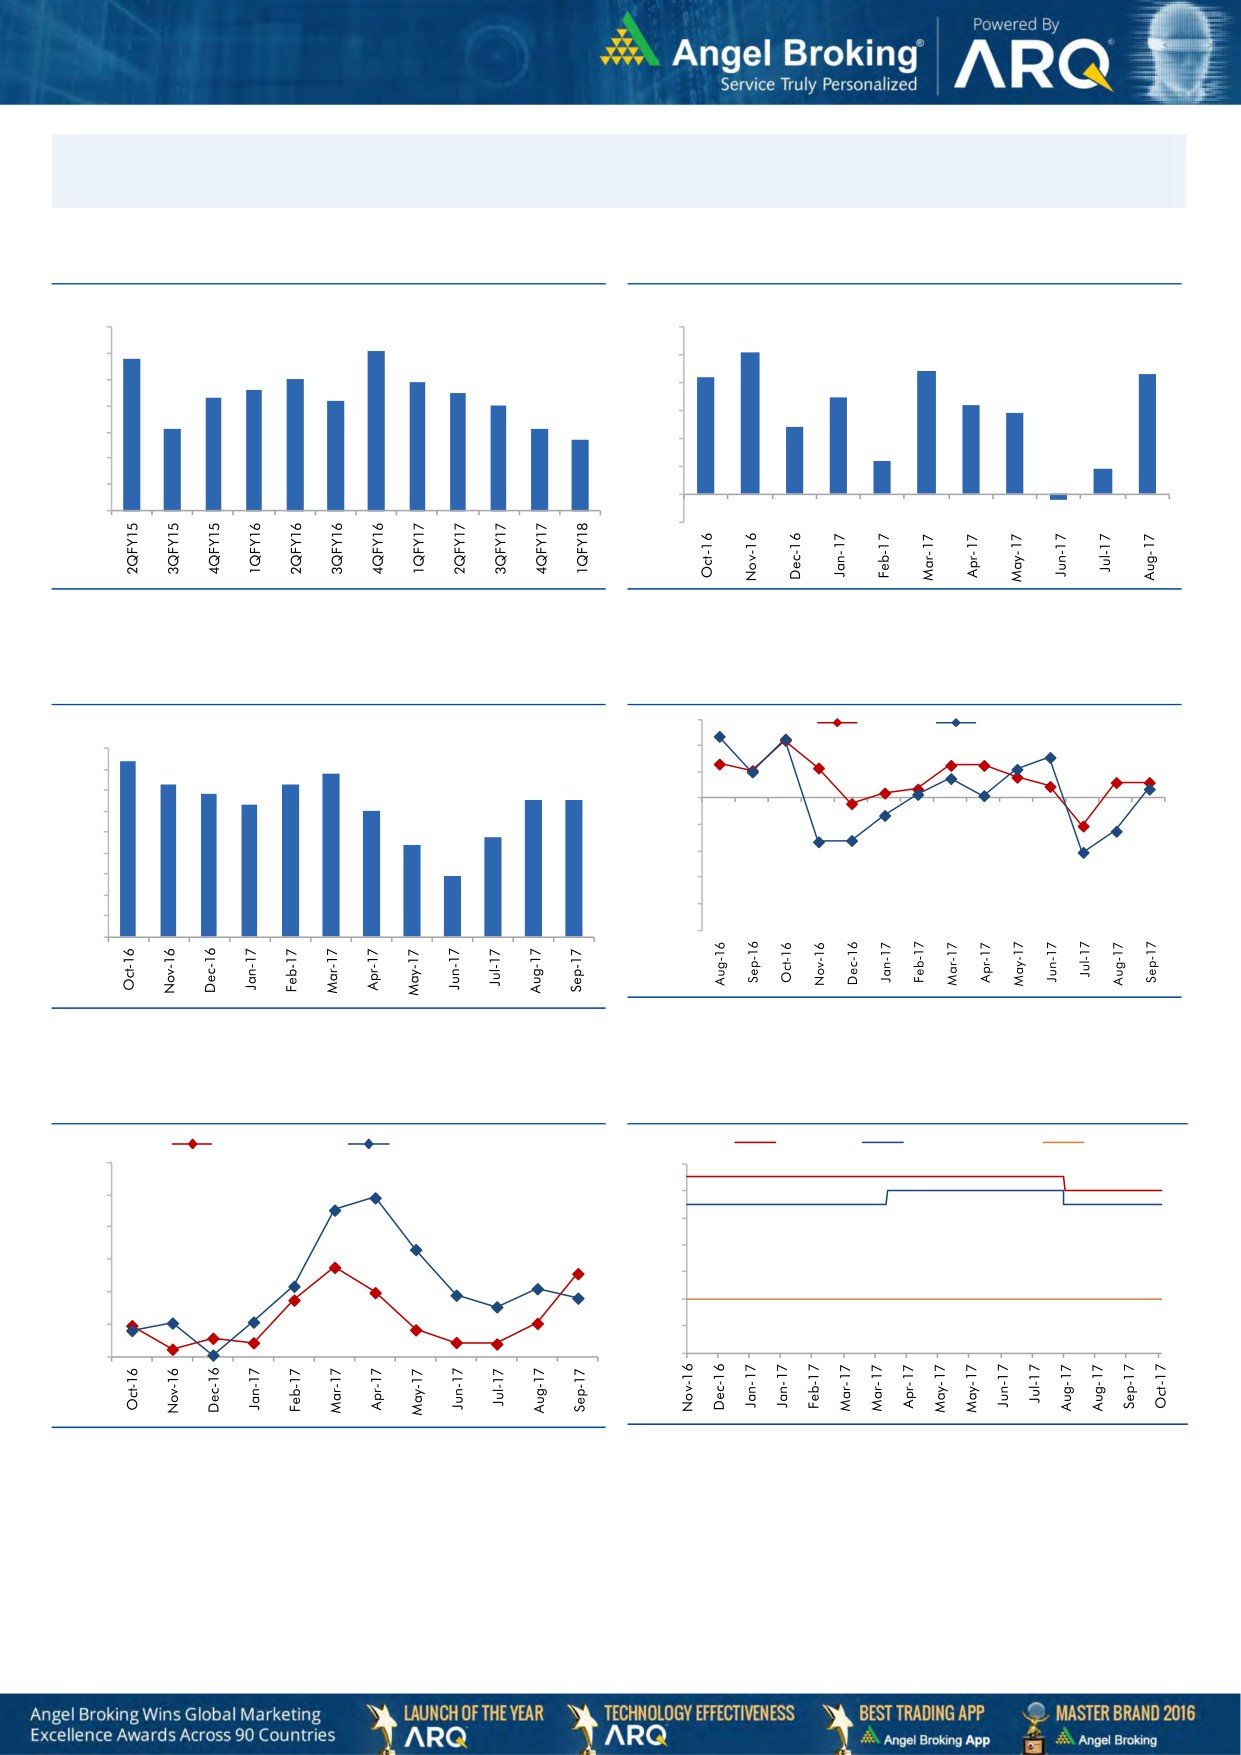
Macro watch
Exhibit 1: Quarterly GDP trends
Exhibit 2: IIP trends
(%)
(%)
10.0
6.0
9.1
5.1
8.8
9.0
5.0
4.4
4.3
8.0
7.9
4.2
7.6
7.5
8.0
7.3
7.2
4.0
3.5
7.0
3.2
2.9
7.0
6.1
6.1
3.0
2.4
5.7
6.0
2.0
1.2
0.9
5.0
1.0
4.0
-
3.0
(1.0)
(0.2)
Source: CSO, Angel Research
Source: MOSPI, Angel Research
Exhibit 3: Monthly CPI inflation trends
Exhibit 4: Manufacturing and services PMI
56.0
Mfg. PMI
Services PMI
(%)
4.5
4.2
54.0
3.9
4.0
3.6
3.7
52.0
3.4
3.3
3.3
3.5
3.2
3.0
50.0
3.0
2.2
2.4
48.0
2.5
2.0
46.0
1.5
1.5
44.0
1.0
42.0
0.5
40.0
-
Source: Market, Angel Research; Note: Level above 50 indicates expansion
Source: MOSPI, Angel Research
Exhibit 5: Exports and imports growth trends
Exhibit 6: Key policy rates
(%)
Exports yoy growth
Imports yoy growth
(%)
Repo rate
Reverse Repo rate
CRR
60.0
6.50
50.0
6.00
5.50
40.0
5.00
30.0
4.50
20.0
4.00
10.0
3.50
0.0
3.00
Source: Bloomberg, Angel Research
Source: RBI, Angel Research
Market Outlook
October 24, 2017
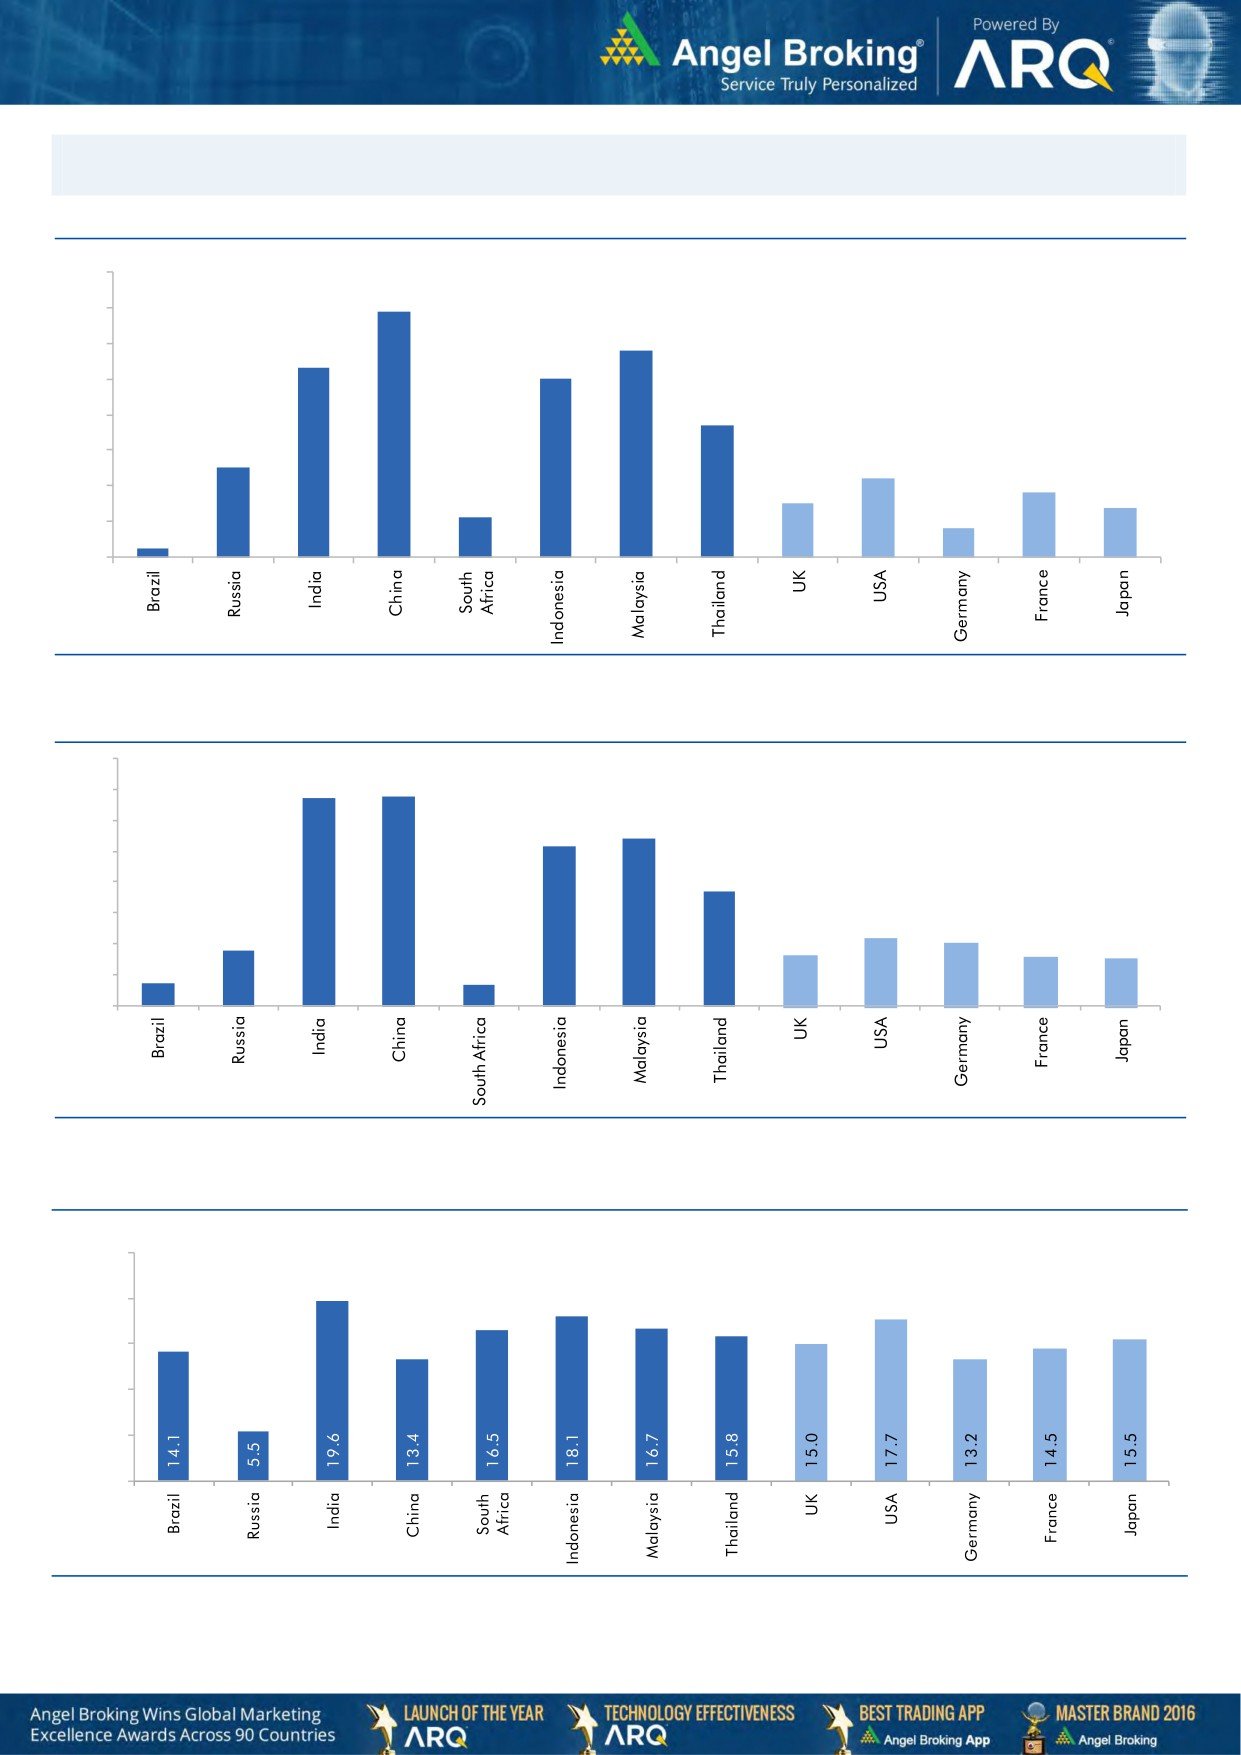
Global watch
Exhibit 1: Latest quarterly GDP Growth (%, yoy) across select developing and developed countries
(%)
8.0
6.9
7.0
5.8
6.0
5.3
5.0
5.0
1.1
3.7
4.0
2.5
3.0
2.2
1.8
2.0
1.5
1.4
0.8
1.0
0.3
-
Source: Bloomberg, Angel Research
Exhibit 2: 2017 GDP Growth projection by IMF (%, yoy) across select developing and developed countries
(%)
6.7
6.8
7.0
6.0
5.4
5.2
5.0
3.7
4.0
3.0
1.8
2.2
2.0
1.7
1.6
2.0
0.7
1.5
0.7
1.0
-
Source: IMF, Angel Research
Exhibit 3: One year forward P-E ratio across select developing and developed countries
(x)
25.0
20.0
15.0
10.0
5.0
-
Source: IMF, Angel Research
Market Outlook
October 24, 2017
Exhibit 4: Relative performance of indices across globe
Returns (%)
C ountry
Name of index
Closing price
1M
3M
1YR
Brazil
Bovespa
75,413
(0.8)
16.6
18.8
Russia
Micex
2,064
0.2
7.3
4.4
India
Nifty
10,185
0.4
2.9
17.6
China
Shanghai Composite
3,381
1.0
4.8
10.5
South Africa
Top 40
51,670
4.2
8.1
15.0
Mexico
Mexbol
49,548
(2.0)
(4.2)
3.0
Indonesia
LQ45
988
0.8
2.9
7.1
Malaysia
KLCI
1,741
(2.0)
(0.8)
4.6
Thailand
SET 50
1,079
0.3
7.9
19.0
USA
Dow Jones
23,274
4.1
8.2
27.7
UK
FTSE
7,524
3.6
2.0
7.2
Japan
Nikkei
21,697
6.8
7.7
28.4
Germany
DAX
13,003
3.5
6.5
21.3
France
CAC
5,387
2.3
4.4
19.5
Source: Bloomberg, Angel Research, p68in4
Stock Watch
October 24, 2017
Company Name
Reco
CMP
Target
Mkt Cap
Sales ( Čcr )
OPM(%)
EPS (Č)
PER(x)
P/BV(x)
RoE(%)
EV/Sales(x)
(Č)
Price ( Č)
( Č cr )
FY18E FY19E
FY18E
FY19E
FY18E
FY19E
FY18E
FY19E
FY18E
FY19E
FY18E
FY19E
FY18E
FY19E
Agri / Agri Chemical
Rallis
Reduce
239
209
4,648
1,873
2,099
15.0
15.0
9.5
10.5
25.2
22.8
3.8
3.5
15.8
16.0
2.4
2.1
United Phosphorus
Accumulate
779
820
39,579
18,922
21,949
18.0
18.5
36.2
45.6
21.5
17.1
4.5
3.7
22.7
23.8
2.3
1.9
Auto & Auto Ancillary
Ashok Leyland
Neutral
128
-
37,562
23,339
27,240
10.1
10.8
4.7
6.2
27.6
20.7
5.5
4.9
20.0
23.6
1.6
1.3
Bajaj Auto
Neutral
3,216
-
93,056
23,936
27,955
19.5
20.1
142.7
167.3
22.5
19.2
4.9
4.4
21.8
22.8
3.5
2.9
Bharat Forge
Buy
640
875
29,784
7,637
8,755
21.7
23.2
36.1
47.3
17.7
13.5
3.2
2.7
18.5
20.8
3.8
3.2
Eicher Motors
Neutral
31,141
-
84,773
19,043
22,837
19.5
19.9
835.4
1,019.0
37.3
30.6
13.9
10.7
40.9
37.8
4.3
3.6
Gabriel India
Neutral
202
-
2,894
1,782
2,033
9.7
10.2
7.1
8.9
28.4
22.8
5.7
4.8
21.0
22.2
1.6
1.4
Hero Motocorp
Accumulate
3,790
4,129
75,693
32,239
36,878
16.0
15.6
184.4
206.5
20.6
18.4
6.5
5.7
31.3
30.7
2.1
1.8
Jamna Auto Industries Neutral
59
-
2,339
1,441
1,662
14.4
14.8
13.9
17.6
4.2
3.3
1.2
0.9
30.0
31.0
1.6
1.4
Mahindra and Mahindra Neutral
1,367
-
84,906
46,971
53,816
13.6
14.0
67.7
79.8
20.2
17.1
2.9
2.6
15.0
15.9
1.7
1.4
Maruti
Accumulate
7,819
8,658
236,209
81,825
101,245
15.0
15.0
283.5
356.0
27.6
22.0
6.0
4.9
21.9
22.4
2.6
2.0
Minda Industries
Neutral
839
-
7,248
4,328
5,084
11.0
11.9
27.3
36.4
30.8
23.0
6.5
5.1
23.1
25.6
1.8
1.5
Motherson Sumi
Neutral
358
-
75,418
55,937
64,445
10.8
11.4
16.9
21.1
21.2
17.0
4.7
4.8
25.2
25.4
1.4
1.2
Tata Motors
Neutral
422
-
121,933
303,167
343,649
11.8
13.8
33.1
54.7
12.8
7.7
2.1
1.7
16.9
23.0
0.5
0.4
TVS Motor
Neutral
686
-
32,572
13,992
16,216
9.0
9.4
17.1
20.3
40.2
33.8
10.7
8.3
29.7
27.7
2.3
1.9
Amara Raja Batteries
Buy
694
858
11,848
6,140
7,122
14.3
15.6
29.3
39.0
23.7
17.8
4.0
3.4
17.1
19.0
1.9
1.7
Exide Industries
Neutral
206
-
17,523
8,689
9,854
15.1
15.2
9.7
11.0
21.4
18.7
3.8
3.3
15.7
16.1
1.8
1.5
Apollo Tyres
Neutral
240
-
12,214
15,739
17,326
13.3
14.6
20.4
26.7
11.8
9.0
1.4
1.3
20.4
26.7
1.0
0.9
Ceat
Neutral
1,684
-
6,813
6,661
7,717
11.1
14.2
116.2
178.2
14.5
9.5
2.5
2.1
15.2
21.3
1.1
1.0
JK Tyres
Neutral
147
-
3,339
8,318
9,239
16.2
16.4
21.0
27.5
7.0
5.4
1.4
1.1
19.1
20.4
0.8
0.7
Swaraj Engines
Neutral
1,982
-
2,461
788
889
16.4
16.5
71.6
81.0
27.7
24.5
8.0
7.4
29.6
31.0
2.8
2.4
Subros
Neutral
264
-
1,581
1,855
2,135
11.6
11.8
10.3
14.7
25.7
18.0
3.9
3.3
15.8
19.1
1.1
0.9
Capital Goods
BEML
Neutral
1,722
-
7,172
4,286
5,194
7.1
8.2
42.9
58.1
40.1
29.6
3.3
3.0
7.6
8.7
1.7
1.4
Bharat Electronics
Neutral
174
-
42,825
10,258
12,470
19.6
19.5
7.3
8.6
23.9
20.3
0.5
0.4
20.4
21.9
3.7
3.0
Voltas
Neutral
543
-
17,967
6,778
8,004
9.6
11.0
17.1
22.4
31.8
24.2
7.6
6.6
17.7
19.8
2.3
2.0
BHEL
Neutral
87
-
31,849
33,200
39,167
6.8
9.5
6.2
11.2
14.0
7.8
0.6
0.6
4.6
8.0
0.5
0.4
Blue Star
Accumulate
805
867
7,711
5,220
6,207
6.3
6.6
16.8
22.3
47.9
36.1
9.5
8.4
19.9
23.3
1.4
1.2
CG Power and Industrial
Neutral
81
-
5,055
6,555
7,292
7.5
7.5
-
0.8
8,065.0
100.8
1.3
1.3
0.1
1.2
0.9
0.8
Solutions
Greaves Cotton
Neutral
130
-
3,180
1,778
1,993
14.7
15.1
8.1
9.1
16.1
14.3
3.6
3.4
21.8
23.6
1.6
1.4
Stock Watch
October 24, 2017
Company Name
Reco
CMP
Target
Mkt Cap
Sales ( Čcr )
OPM(%)
EPS (Č)
PER(x)
P/BV(x)
RoE(%)
EV/Sales(x)
(Č)
Price ( Č)
( Č cr )
FY18E FY19E
FY18E
FY19E
FY18E
FY19E
FY18E
FY19E
FY18E
FY19E
FY18E
FY19E
FY18E
FY19E
Capital Goods
KEC International
Buy
297
350
7,638
9,779
11,113
9.4
9.8
14.2
18.2
20.9
16.3
4.0
3.3
21.1
22.1
1.0
0.9
KEI Industries
Buy
322
380
2,505
3,001
3,391
10.0
10.0
13.0
16.1
24.8
20.0
4.5
3.7
18.2
18.7
1.0
0.9
Thermax
Neutral
977
-
11,637
4,125
4,747
10.3
10.8
26.7
31.5
36.6
31.0
4.1
3.7
11.2
12.0
2.6
2.2
VATech Wabag
Accumulate
598
681
3,267
3,867
4,126
9.6
10.0
34.9
39.8
17.2
15.0
2.8
2.4
17.7
17.5
0.9
0.8
Cement
ACC
Neutral
1,780
-
33,432
12,255
13,350
13.5
14.3
58.0
66.2
30.7
26.9
3.6
3.4
11.5
12.2
2.7
2.5
Ambuja Cements
Neutral
282
-
55,946
10,250
11,450
17.5
19.0
7.2
8.3
39.1
34.0
2.8
2.7
7.0
7.8
5.2
4.6
India Cements
Neutral
181
-
5,576
6,135
6,750
14.8
15.2
8.5
11.5
21.3
15.7
1.1
1.0
4.8
6.2
1.3
1.1
JK Cement
Neutral
954
-
6,671
4,150
4,775
19.2
20.0
49.0
63.5
19.5
15.0
3.1
2.7
17.0
18.5
2.0
1.7
J K Lakshmi Cement
Neutral
409
-
4,810
3,422
3,757
15.5
17.0
13.5
23.2
30.3
17.6
3.1
2.7
10.8
15.5
1.8
1.6
Orient Cement
Neutral
158
-
3,230
2,215
3,233
16.8
17.0
5.9
6.9
26.7
22.9
2.0
1.9
10.8
10.1
2.5
1.6
UltraTech Cement
Neutral
4,209
-
115,553
28,250
35,150
20.2
23.5
77.5
122.2
54.3
34.4
4.6
4.2
9.6
14.8
4.6
3.6
Construction
KNR Constructions
Neutral
212
-
2,987
1,846
2,203
14.5
14.5
12.1
13.7
17.6
15.6
1.0
0.8
17.5
16.7
1.7
1.4
Larsen & Toubro
Neutral
1,135
-
158,934
95,787
109,476
10.2
11.6
44.5
50.8
25.5
22.4
3.2
2.9
12.9
13.1
2.2
2.0
Gujarat Pipavav Port
Neutral
139
-
6,727
739
842
61.6
62.7
5.1
6.2
27.3
22.6
3.4
3.3
12.7
14.9
8.6
7.4
PNC Infratech
Neutral
159
-
4,084
2,040
2,935
13.0
13.0
6.4
9.0
24.9
17.7
0.6
0.6
9.7
12.2
2.0
1.4
Simplex Infra
Neutral
461
-
2,282
6,012
6,619
11.6
11.7
21.1
31.0
21.9
14.9
1.5
1.4
6.5
8.6
0.9
0.8
Sadbhav Engineering
Accumulate
277
298
4,754
3,823
4,426
10.7
10.8
10.3
11.8
26.9
23.5
3.2
2.8
10.1
10.5
1.6
1.4
NBCC
Neutral
254
-
22,869
9,099
12,706
6.4
6.4
7.3
9.6
34.9
26.6
1.5
1.2
27.5
30.5
2.4
1.7
MEP Infra
Neutral
97
-
1,571
2,403
2,910
18.3
16.8
2.4
6.1
41.1
15.9
15.6
10.5
35.2
55.8
1.8
1.5
SIPL
Neutral
96
-
3,374
2,060
2,390
46.8
47.7
(5.8)
(3.1)
3.6
4.1
(14.2)
(2.3)
6.4
6.0
Engineers India
Neutral
152
-
10,223
1,795
2,611
21.1
22.4
5.9
8.1
25.7
18.7
1.8
1.8
12.9
16.1
4.1
2.6
Financials
Axis Bank
Buy
450
580
107,868
32,558
35,843
3.5
3.2
27.8
41.0
16.2
11.0
1.8
1.5
11.4
14.9
-
-
Bank of Baroda
Neutral
138
-
31,763
22,533
26,079
2.4
2.4
12.0
20.9
11.5
6.6
0.7
0.7
6.6
11.0
-
-
Canara Bank
Neutral
306
-
18,265
17,925
20,235
2.0
2.1
18.5
36.5
16.5
8.4
0.6
0.6
3.4
6.2
-
-
Can Fin Homes
Buy
538
2,128
7,159
586
741
3.5
3.5
107.8
141.0
5.0
3.8
1.1
0.9
24.1
25.6
-
-
Cholamandalam Inv. &
Accumulate
1,142
1,230
17,843
2,826
3,307
6.3
6.3
53.7
64.6
21.3
17.7
3.6
3.1
18.3
18.9
-
-
Fin. Co.
Dewan Housing Finance Accumulate
583
670
18,278
2,676
3,383
2.4
2.7
37.4
49.7
15.6
11.7
2.0
1.8
13.8
16.2
-
-
Equitas Holdings
Buy
152
235
5,145
1,125
1,380
9.6
9.8
1.5
6.0
101.2
25.3
2.3
2.1
2.4
8.2
-
-
Federal Bank
Neutral
125
-
24,292
4,896
5,930
2.8
3.1
5.4
7.6
23.2
16.5
2.0
1.8
8.5
11.0
-
-
Stock Watch
October 24, 2017
Company Name
Reco
CMP
Target
Mkt Cap
Sales ( Čcr )
OPM(%)
EPS (Č)
PER(x)
P/BV(x)
RoE(%)
EV/Sales(x)
(Č)
Price ( Č)
( Č cr )
FY18E FY19E
FY18E
FY19E
FY18E
FY19E
FY18E
FY19E
FY18E
FY19E
FY18E
FY19E
FY18E
FY19E
Financials
GIC Housing
Buy
499
655
2,690
376
477
3.6
3.7
33.0
40.0
15.1
12.5
2.7
2.3
20.0
23.0
-
-
HDFC Bank
Neutral
1,863
-
480,823
55,236
63,253
4.5
4.4
68.9
82.4
27.1
22.6
4.7
3.9
18.7
18.5
-
-
ICICI Bank
Buy
263
315
168,456
42,361
51,378
3.6
3.9
18.4
25.7
14.3
10.2
1.6
1.5
11.3
15.0
-
-
Karur Vysya Bank
Buy
130
180
7,880
3,289
3,630
3.7
3.9
10.8
14.1
12.0
9.3
1.4
1.3
12.5
14.7
-
-
LIC Housing Finance
Neutral
652
-
32,927
4,895
6,332
3.4
3.7
50.7
66.8
12.9
9.8
2.6
2.1
21.7
23.8
-
-
Punjab Natl.Bank
Neutral
131
-
27,855
23,708
25,758
2.1
2.1
5.9
16.4
22.3
8.0
0.7
0.6
3.0
8.3
-
-
RBL Bank
Neutral
528
-
21,795
2,309
2,888
2.6
2.5
16.4
19.1
32.2
27.7
4.1
3.6
13.3
13.8
-
-
Repco Home Finance
Buy
655
825
4,098
496
597
4.4
4.2
38.5
48.7
17.0
13.4
3.1
2.5
19.6
20.6
-
-
South Ind.Bank
Neutral
32
-
5,756
3,195
3,567
3.0
3.1
3.0
3.8
10.6
8.3
1.1
0.9
10.5
11.9
-
-
St Bk of India
Neutral
246
-
212,133
105,827
121,056
2.4
2.5
16.1
25.6
15.3
9.6
1.2
1.1
6.6
9.9
-
-
Union Bank
Neutral
127
-
9,200
14,650
16,225
2.3
2.3
23.1
32.5
5.5
3.9
0.4
0.4
7.1
9.2
-
-
Yes Bank
Neutral
354
-
81,094
11,088
13,138
3.0
2.9
84.0
99.3
4.2
3.6
0.6
0.6
16.3
16.8
-
-
FMCG
Akzo Nobel India
Neutral
1,827
-
8,761
3,164
3,607
13.8
13.7
58.6
67.9
31.2
26.9
7.7
6.8
24.5
25.1
2.6
2.3
Asian Paints
Neutral
1,172
-
112,456
17,603
20,615
18.6
18.6
2,128.9
2,543.3
0.6
0.5
11.6
9.8
28.0
28.9
6.2
5.2
Britannia
Neutral
4,666
-
56,016
9,690
11,278
14.8
15.4
84.0
101.0
55.5
46.2
20.2
16.1
40.6
39.0
5.7
4.9
Colgate
Neutral
1,062
-
28,878
4,420
5,074
24.9
25.3
28.6
32.8
37.1
32.4
14.6
11.8
43.8
40.5
6.3
5.4
Dabur India
Neutral
317
-
55,840
8,346
9,344
19.6
19.9
7.8
9.0
40.6
35.2
8.2
7.4
25.2
24.8
6.3
5.5
GlaxoSmith Con*
Neutral
4,944
-
20,792
5,072
5,760
18.2
18.4
176.3
199.2
28.0
24.8
6.0
5.4
21.2
21.7
3.4
3.0
Godrej Consumer
Neutral
938
-
63,936
10,171
11,682
20.8
21.5
21.7
27.1
43.2
34.6
9.7
8.4
22.3
23.4
6.4
5.5
HUL
Neutral
1,249
-
270,268
37,077
41,508
20.3
21.8
5,189.9
6,318.5
0.2
0.2
38.1
32.5
74.8
82.0
7.1
6.4
ITC
Neutral
267
-
324,910
44,588
49,853
37.0
37.3
9.6
11.0
27.8
24.3
6.8
6.5
25.1
27.3
6.8
6.0
Marico
Neutral
317
-
40,927
6,788
7,766
18.5
19.2
7.1
8.5
44.7
37.3
15.6
13.4
36.9
38.0
5.9
5.1
Nestle*
Neutral
7,245
-
69,855
10,083
11,182
20.0
20.9
119.7
141.3
60.5
51.3
213.3
195.0
36.7
39.8
6.6
5.9
Tata Global
Neutral
203
-
12,818
7,121
7,641
11.9
12.3
6.9
8.0
29.4
25.4
2.0
1.9
6.8
7.2
1.6
1.5
Procter & Gamble
Neutral
8,610
-
27,949
3,034
3,579
27.1
27.7
167.7
198.8
51.3
43.3
13.8
11.9
28.8
29.5
8.6
7.2
Hygiene
IT
HCL Tech^
Accumulate
935
1,014
133,438
52,342
57,053
20.9
20.9
62.8
67.6
14.9
13.8
3.3
2.9
22.4
20.6
2.2
1.9
Infosys
Buy
940
1,179
215,837
73,963
80,619
26.0
26.0
64.4
69.3
14.6
13.6
2.9
2.7
19.7
19.6
2.3
2.1
TCS
Neutral
2,586
-
509,543
127,403
138,870
27.6
27.6
144.5
156.0
17.9
16.6
5.3
4.9
29.7
29.8
3.7
3.3
Tech Mahindra
Buy
462
533
45,091
31,015
33,496
15.0
15.0
35.6
38.1
13.0
12.1
2.2
2.1
17.0
16.3
1.2
1.1
Stock Watch
October 24, 2017
Company Name
Reco
CMP
Target
Mkt Cap
Sales ( Čcr )
OPM(%)
EPS (Č)
PER(x)
P/BV(x)
RoE(%)
EV/Sales(x)
(Č)
Price ( Č)
( Č cr )
FY18E FY19E
FY18E
FY19E
FY18E
FY19E
FY18E
FY19E
FY18E
FY19E
FY18E
FY19E
FY18E
FY19E
IT
Wipro
Neutral
297
-
144,346
58,536
61,858
20.3
20.3
18.2
19.1
16.3
15.5
2.5
2.2
14.6
13.4
2.4
2.3
Media
D B Corp
Neutral
367
-
6,756
2,404
2,625
30.5
31.5
23.7
26.9
15.5
13.7
3.6
3.1
23.5
22.8
2.7
2.4
HT Media
Neutral
103
-
2,407
2,589
2,830
15.1
15.4
8.3
10.9
12.5
9.5
1.0
0.9
8.4
10.4
0.5
0.3
Jagran Prakashan
Buy
177
225
5,793
2,541
2,835
28.5
28.7
12.7
14.1
14.0
12.6
2.9
2.5
21.3
21.4
2.1
1.8
Sun TV Network
Neutral
804
-
31,667
3,238
3,789
51.9
55.1
30.9
38.0
26.0
21.2
7.4
6.5
30.0
31.0
9.3
7.8
Hindustan Media
Neutral
241
-
1,770
1,002
1,074
23.3
23.5
29.2
33.8
8.3
7.1
1.3
1.1
15.6
15.4
0.8
0.5
Ventures
TV Today Network
Buy
352
435
2,099
667
727
27.7
27.7
18.6
20.1
18.9
17.5
2.9
3.0
15.6
17.3
2.7
2.5
Music Broadcast Limited Accumulate
386
434
2,202
271
317
91.0
109.0
6.0
10.0
64.3
38.6
4.0
3.6
6.5
9.3
7.7
6.4
Metals & Mining
Coal India
Neutral
290
-
179,984
82,301
91,235
17.0
18.0
17.1
20.5
17.0
14.1
3.2
3.0
45.0
55.0
1.9
1.7
Hind. Zinc
Neutral
318
-
134,281
22,108
24,555
57.0
58.0
22.1
26.3
14.4
12.1
4.7
3.8
32.0
35.0
5.1
4.2
Hindalco
Neutral
272
-
61,116
102,350
105,355
13.5
14.5
21.5
24.5
12.7
11.1
1.8
1.5
15.0
15.2
1.2
1.1
JSW Steel
Neutral
260
-
62,763
64,500
68,245
21.1
21.5
20.1
21.2
12.9
12.3
2.4
2.0
-
-
1.7
1.6
NMDC
Neutral
121
-
38,141
10,209
11,450
47.0
48.0
11.1
12.1
10.9
10.0
1.5
1.4
-
-
3.2
2.9
SAIL
Neutral
59
-
24,429
54,100
63,555
3.0
10.0
(10.0)
1.5
39.4
0.8
0.8
-
-
1.4
1.2
Vedanta
Neutral
329
-
122,370
81,206
87,345
28.0
29.0
26.5
33.5
12.4
9.8
2.8
2.4
-
-
2.3
1.9
Tata Steel
Neutral
711
-
69,087
121,445
126,500
16.2
17.2
65.4
81.3
10.9
8.8
1.7
1.5
-
-
1.1
1.0
Oil & Gas
GAIL
Neutral
434
-
73,479
53,115
52,344
14.2
15.3
30.0
31.1
14.5
14.0
1.8
1.7
-
-
1.1
1.1
ONGC
Neutral
172
-
220,218
83,111
84,934
44.2
44.9
16.4
16.9
10.5
10.2
1.3
1.2
-
-
2.5
2.5
Indian Oil Corp
Neutral
404
-
196,397
396,116
432,560
8.5
8.8
40.1
42.2
10.1
9.6
1.7
1.6
-
-
0.6
0.6
Reliance Industries
Neutral
938
-
610,122
257,711
267,438
17.0
18.2
89.1
89.5
10.5
10.5
1.0
0.9
-
-
2.0
1.9
Pharmaceuticals
Alembic Pharma
Buy
496
600
9,349
3,903
4,584
18.2
19.2
21.8
27.2
22.8
18.2
4.1
3.4
19.8
20.6
2.4
2.1
Alkem Laboratories Ltd
Accumulate
1,863
2,079
22,279
6,320
7,341
17.5
19.8
72.7
96.6
25.6
19.3
4.5
3.8
16.7
18.7
3.5
2.9
Aurobindo Pharma
Accumulate
751
823
43,970
17,086
19,478
22.1
22.0
44.7
51.4
16.8
14.6
3.7
3.0
24.7
22.7
2.7
2.3
Aventis*
Neutral
4,222
-
9,723
2,508
2,862
16.8
16.8
139.9
153.8
30.2
27.5
4.4
3.6
23.5
25.8
3.5
2.9
Cadila Healthcare
Reduce
491
426
50,281
11,584
13,228
20.3
20.4
18.7
21.3
26.3
23.1
5.9
4.8
24.6
22.9
4.2
3.6
Cipla
Sell
594
458
47,774
16,619
19,437
15.4
16.2
19.7
24.3
30.1
24.4
3.4
3.0
12.0
13.2
3.0
2.6
Dr Reddy's
Neutral
2,365
-
39,207
15,844
17,973
17.6
18.2
91.7
111.0
25.8
21.3
2.9
2.6
11.9
13.0
2.7
2.4
GSK Pharma*
Neutral
2,436
-
20,632
3,260
3,651
15.0
18.0
46.1
58.6
52.8
41.6
10.9
11.2
20.0
26.5
6.2
5.7
Indoco Remedies
Sell
253
153
2,335
1,154
1,310
14.9
14.9
11.3
12.7
22.4
20.0
3.2
2.8
15.0
15.0
2.2
1.8
Stock Watch
October 24, 2017
Company Name
Reco
CMP
Target
Mkt Cap
Sales ( Čcr )
OPM(%)
EPS (Č)
PER(x)
P/BV(x)
RoE(%)
EV/Sales(x)
(Č)
Price ( Č)
( Č cr )
FY18E FY19E
FY18E
FY19E
FY18E
FY19E
FY18E
FY19E
FY18E
FY19E
FY18E
FY19E
FY18E
FY19E
Pharmaceuticals
Ipca labs
Accumulate
489
540
6,170
3,593
4,022
14.5
15.5
19.4
25.2
25.2
19.4
2.3
2.1
9.5
11.2
1.8
1.6
Lupin
Buy
1,037
1,467
46,838
18,657
21,289
21.3
23.3
52.8
66.7
19.6
15.5
3.0
2.5
16.3
17.5
2.5
2.1
Natco Pharma
Accumulate
988
1,057
17,221
1,886
2,016
32.3
29.5
23.2
22.0
42.7
44.8
8.9
7.9
20.9
17.6
9.0
8.4
Sun Pharma
Neutral
540
-
129,619
32,899
36,451
26.9
25.4
31.6
32.3
17.1
16.7
3.0
2.6
18.7
18.8
3.6
3.1
Syngene International
Accumulate
501
557
10,025
1,402
1,823
32.8
36.0
15.9
20.7
31.6
24.3
5.9
4.9
18.7
20.0
7.1
5.5
Power
Tata Power
Neutral
82
-
22,112
32,547
33,806
20.5
20.5
4.7
5.4
17.4
15.3
1.7
1.4
10.5
10.5
1.7
1.6
NTPC
Neutral
177
-
145,656
86,070
101,246
28.3
30.7
12.9
16.2
13.7
10.9
1.4
1.3
10.6
12.4
3.1
2.7
Power Grid
Neutral
213
-
111,276
29,183
32,946
89.7
90.0
18.0
20.8
11.9
10.2
2.0
1.8
17.7
18.2
7.7
7.2
Real Estate
Prestige Estate
Neutral
279
-
10,466
4,607
5,146
21.0
22.2
7.9
9.8
35.3
28.5
2.2
2.0
10.3
12.0
3.4
3.1
MLIFE
Accumulate
466
522
2,390
487
590
12.3
17.8
21.0
31.2
22.2
14.9
1.2
1.1
5.2
7.4
3.6
3.0
Telecom
Bharti Airtel
Neutral
498
-
198,871
97,903
105,233
36.0
36.3
9.3
11.1
53.5
45.0
2.6
2.4
5.0
5.6
3.0
2.7
Idea Cellular
Neutral
98
-
35,401
35,012
37,689
27.1
27.7
(4.4)
(2.7)
1.5
1.6
(6.8)
(4.6)
2.3
2.1
zOthers
Abbott India
Neutral
4,158
-
8,836
3,244
3,723
14.9
16.1
167.5
209.4
24.8
19.9
5.5
4.6
23.7
24.8
2.4
2.0
Asian Granito
Accumulate
499
570
1,502
1,169
1,286
12.5
12.5
16.0
19.7
31.3
25.3
3.3
2.9
10.7
11.6
1.5
1.3
Bajaj Electricals
Neutral
405
-
4,114
4,646
5,301
6.7
7.6
16.1
22.3
25.2
18.2
4.1
3.5
16.4
19.2
0.9
0.8
Banco Products (India)
Neutral
217
-
1,554
1,530
1,695
13.2
12.7
19.0
20.0
11.4
10.9
1.8
1.6
0.2
0.2
0.9
102.8
Coffee Day Enterprises
Neutral
222
-
4,567
3,494
3,913
17.4
18.0
4.8
5.7
-
38.9
2.0
1.9
-
0.1
1.8
1.6
Ltd
Elecon Engineering
Neutral
68
-
768
171
201
15.0
16.2
36.0
43.0
1.9
1.6
0.2
0.2
0.1
0.1
3.9
3.3
Garware Wall Ropes
Neutral
900
-
1,970
928
1,003
15.2
15.2
39.4
43.2
22.8
20.9
3.8
3.2
16.5
15.4
2.0
1.8
Goodyear India*
Neutral
819
-
1,889
1,717
1,866
11.8
12.3
47.9
49.8
17.1
16.5
2.6
2.3
15.6
15.7
0.8
113.9
Hitachi
Neutral
2,624
-
7,135
2,355
2,715
10.3
10.8
49.0
60.9
53.6
43.1
12.5
9.9
0.2
0.2
3.1
2.6
HSIL
Neutral
432
-
3,121
2,240
2,670
14.6
15.0
17.0
22.0
25.4
19.6
2.1
2.0
0.1
0.1
1.6
1.3
Interglobe Aviation
Neutral
1,160
-
41,941
22,570
27,955
14.2
15.0
63.6
81.8
18.3
14.2
9.6
8.1
0.5
0.6
1.5
1.2
Jyothy Laboratories
Neutral
384
-
6,971
1,781
2,044
14.1
15.0
9.4
10.5
41.0
36.5
8.7
8.2
0.2
0.2
4.1
3.5
Linc Pen & Plastics
Neutral
243
-
360
420
462
9.3
9.3
15.3
17.1
15.9
14.2
2.7
2.8
16.9
19.5
0.9
0.8
M M Forgings
Neutral
874
-
1,055
542
642
20.1
21.0
41.6
56.8
21.0
15.4
2.9
2.5
0.1
0.2
2.4
2.1
Mirza International
Neutral
159
-
1,909
1,148
1,285
18.0
18.0
8.0
9.4
19.7
17.0
3.3
2.8
16.3
16.1
1.8
1.6
Navkar Corporation
Buy
199
265
2,834
561
617
41.5
41.5
11.5
12.7
17.3
15.6
1.8
1.6
10.5
10.4
5.7
5.0
Nilkamal
Neutral
1,604
-
2,393
2,317
2,525
11.4
11.1
96.0
105.0
16.7
15.3
2.8
2.5
0.2
0.2
1.0
0.9
Stock Watch
October 24, 2017
Company Name
Reco
CMP
Target Mkt Cap
Sales ( Čcr )
OPM(%)
EPS (Č)
PER(x)
P/BV(x)
RoE(%)
EV/Sales(x)
(Č)
Price ( Č)
( Č cr )
FY18E FY19E FY18E FY19E FY18E FY19E FY18E FY19E FY18E FY19E FY18E FY19E FY18E FY19E
zOthers
Parag Milk Foods
Neutral
275
-
2,316
1,987
2,379
7.6
9.0
12.4
18.3
22.2
15.1
3.1
2.7
8.2
13.2
1.3
1.1
Radico Khaitan
Neutral
225
-
2,993
1,811
1,992
13.2
13.2
8.1
8.8
27.8
25.5
2.8
3.1
10.1
12.0
2.0
1.8
Relaxo Footwears
Neutral
516
-
6,196
1,981
2,310
13.7
14.5
12.0
15.5
43.0
33.3
8.4
6.8
0.2
0.2
3.2
2.7
Siyaram Silk Mills
Accumulate
2,774
2,914
2,600
1,769
1,981
12.7
12.7
113.1
131.1
24.5
21.2
3.8
3.3
15.5
15.5
1.6
1.5
Styrolution ABS India* Neutral
1,022
-
1,797
1,800
1,980
8.0
8.1
42.0
46.2
24.3
22.1
2.7
2.4
0.1
0.1
1.1
1.0
Surya Roshni
Neutral
317
-
1,387
4,870
5,320
7.7
7.8
22.8
28.1
13.9
11.3
1.8
1.6
0.1
0.1
0.5
0.4
TVS Srichakra
Neutral
3,098
-
2,372
2,729
2,893
12.7
12.5
248.5
265.0
12.5
11.7
3.5
2.9
0.3
0.3
0.9
0.8
Visaka Industries
Neutral
685
-
1,088
1,104
1,214
12.1
12.6
31.0
37.9
22.1
18.1
2.7
2.4
0.1
0.1
1.2
1.1
VIP Industries
Accumulate
265
300
3,743
1,450
1,693
10.4
10.5
6.5
7.8
40.5
33.9
8.6
7.5
21.1
22.1
2.6
2.2
Navin Fluorine
Neutral
713
-
3,516
945
1,154
22.4
22.6
28.7
34.8
24.9
20.5
4.1
3.5
-
-
3.2
2.5
Source: Company, Angel Research; Note: *December year end; #September year end; &October year end; Price as on October 23, 2017
Market Outlook
October 24, 2017
Research Team Tel: 022 - 39357800
DISCLAIMER
Angel Broking Private Limited (hereinafter referred to as “Angel”) is a registered Member of National Stock Exchange of India
Limited,Bombay Stock Exchange Limited and Metropolitan Stock Exchange Limited. It is also registered as a Depository Participant with
CDSL and Portfolio Manager with SEBI. It also has registration with AMFI as a Mutual Fund Distributor. Angel Broking Private Limited is a
registered entity with SEBI for Research Analyst in terms of SEBI (Research Analyst) Regulations, 2014 vide registration number
INH000000164. Angel or its associates has not been debarred/ suspended by SEBI or any other regulatory authority for accessing
/dealing in securities Market. Angel or its associates/analyst has not received any compensation / managed or
co-managed public offering of securities of the company covered by Analyst during the past twelve months.
This document is solely for the personal information of the recipient, and must not be singularly used as the basis of any investment
decision. Nothing in this document should be construed as investment or financial advice. Each recipient of this document should make
such investigations as they deem necessary to arrive at an independent evaluation of an investment in the securities of the companies
referred to in this document (including the merits and risks involved), and should consult their own advisors to determine the merits and
risks of such an investment.
Reports based on technical and derivative analysis center on studying charts of a stock's price movement, outstanding positions and
trading volume, as opposed to focusing on a company's fundamentals and, as such, may not match with a report on a company's
fundamentals. Investors are advised to refer the Fundamental and Technical Research Reports available on our website to evaluate the
contrary view, if any.
The information in this document has been printed on the basis of publicly available information, internal data and other reliable
sources believed to be true, but we do not represent that it is accurate or complete and it should not be relied on as such, as this
document is for general guidance only. Angel Broking Pvt. Limited or any of its affiliates/ group companies shall not be in any way
responsible for any loss or damage that may arise to any person from any inadvertent error in the information contained in this report.
Angel Broking Pvt. Limited has not independently verified all the information contained within this document. Accordingly, we cannot
testify, nor make any representation or warranty, express or implied, to the accuracy, contents or data contained within this document.
While Angel Broking Pvt. Limited endeavors to update on a reasonable basis the information discussed in this material, there may be
regulatory, compliance, or other reasons that prevent us from doing so.
This document is being supplied to you solely for your information, and its contents, information or data may not be reproduced,
redistributed or passed on, directly or indirectly.
Neither Angel Broking Pvt. Limited, nor its directors, employees or affiliates shall be liable for any loss or damage that may arise from
or in connection with the use of this information.